


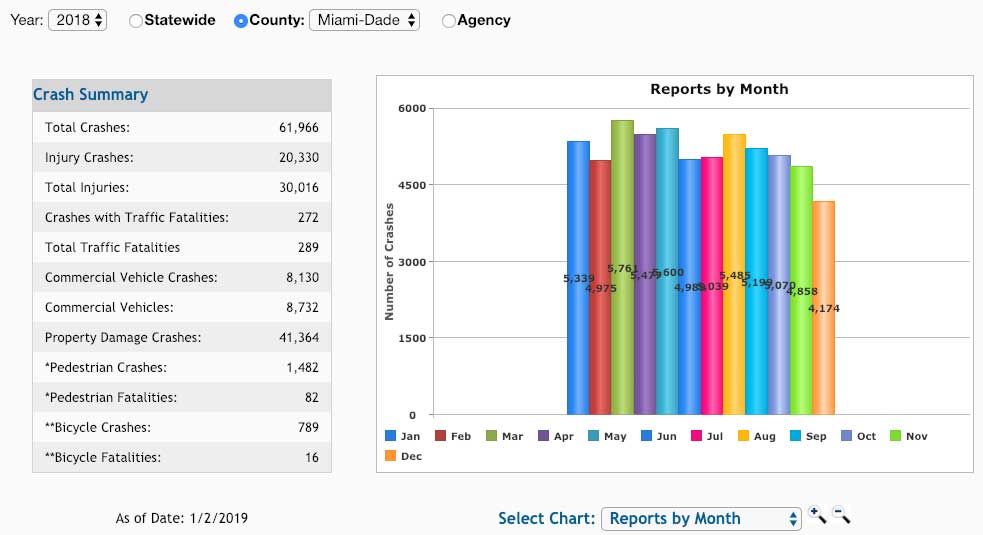
Total Crashes
The total number of crashes in Miami-Dade County dropped from 65,997 in 2017 to 61,966 in 2018. That’s a drop of 7% year over year.
Fatal Accidents in Miami-Dade County
The number of traffic fatalities went up slightly from 285 fatalities in 2017 to 289 fatalities in 2018. That’s a 1% increase in fatalities year over year.
Injury Accidents in Miami-Dade County
The number of injury accidents went down last year. There were 32,392 people injured in crashes in 2017, but only 30,016 injured in 2018. That’s a decrease of 7% and matching the decrease we saw i overall crashes in Miami-Dade County Year over Year.
Pedestrian Fatalities Up 41%
It was less safe to be a pedestrian in 2018 with pedestrian deaths climbing from 58 in 2017 to 82 in 2018. That’s a 41% increase in pedestrians killed in Miami-Dade County year over year.
Pedestrian Fatalities Up 41%
It was less safe to be a pedestrian in 2018 with pedestrian deaths climbing from 58 in 2017 to 82 in 2018. That’s a 41% increase in pedestrians killed in Miami-Dade County year over year.
Bicycle Fatalities
Overall, bicycle crashes were down from 805 to 789 last year, but the fatalities went up from 14 to 16 deaths in 2018.
2017 Miami-Dade Crash Stats

2018 Miami-Dade Crash Stats
Source: Florida Department of Highway Safety and Motor Vehicles
650-9456 #ydiaztowing
????Best Towing Service in Miami????
.
.
.
. https://g.page/r/Ca72as4Wr2-BEBM/r…")


650-9456 #ydiaztowing
????Best Towing Service in Miami????
.
.
.
. https://g.page/r/Ca72as4Wr2-BEBM/r…")

