


Miami’s Top 10 Most Horrible Commutes: The Statistics
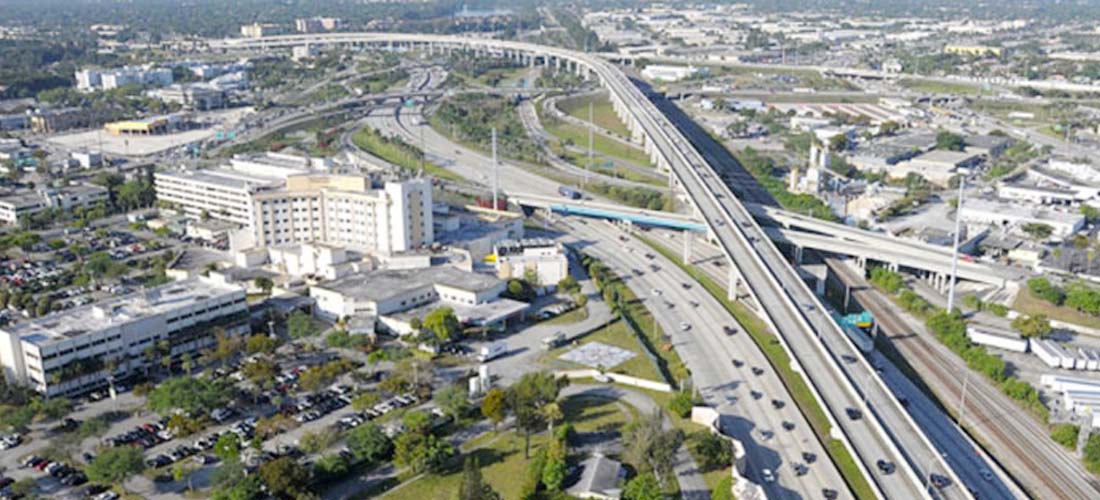
You’d be forgiven if you’ve decided that Miami has the world’s absolute WORST traffic for daily commuters. In fact, Miami has the 10th worst traffic in the world. So which areas have the most painful commutes?
Miami-Dade County commuters saw their average one-way commute increase to 30.6 minutes in 2016, coming in 17% higher than the national average of 26.1 minutes. For the typical Miami commuter, this amounts to over 10.5 days of travel time per year across 50 weeks of work. Those with commutes of over 90-minutes, annual time spent getting to work bumps to over 31 days.
The American Community Survey studied daily commutes across Miami, focusing on statistical geographic areas with populations of over 100,000. Each area was ranked by average one-way commute time — including data on the percentage of commuters with more than 60- and 90-minute journeys.
From the study, here are the top 10 worst commutes in Miami…
#10: North Miami and Golden Glades
– Median commute time: 27 to 33 min.
– Over 60-min. commute: 13.1% of all commuters
– Over 90-min. commute: 4.4% of all commuters
#9: Tamiami Trail Region
#8: Doral, Sweetwater and Fontainebleau

#7: Opa-Locka, West Little River and Westview

#6: Miami Lakes

#5: Homestead and Florida City

– Population: 120,042 (48,436 commuters)
– Median commute time: 33 to 37 min.
– Over 60-min. commute: 23.1% of all commuters
– Over 90-min. commute: 11% of all commuters
#4: South Miami Heights
#3: The Hammocks, Richmond West and Country Walk

– Population: 122,094 (58,751 commuters)
– Median commute time: 35 to 39 min.
– Over 60-min. commute: 24.1% of all commuters
– Over 90-min. commute: 5.2% of all commuters
#2: Kendale Lakes and Kendall

#1: Cutler Bay and Palmetto Bay